


Why 80% of Co-pay Spend Never Becomes a Therapy Start
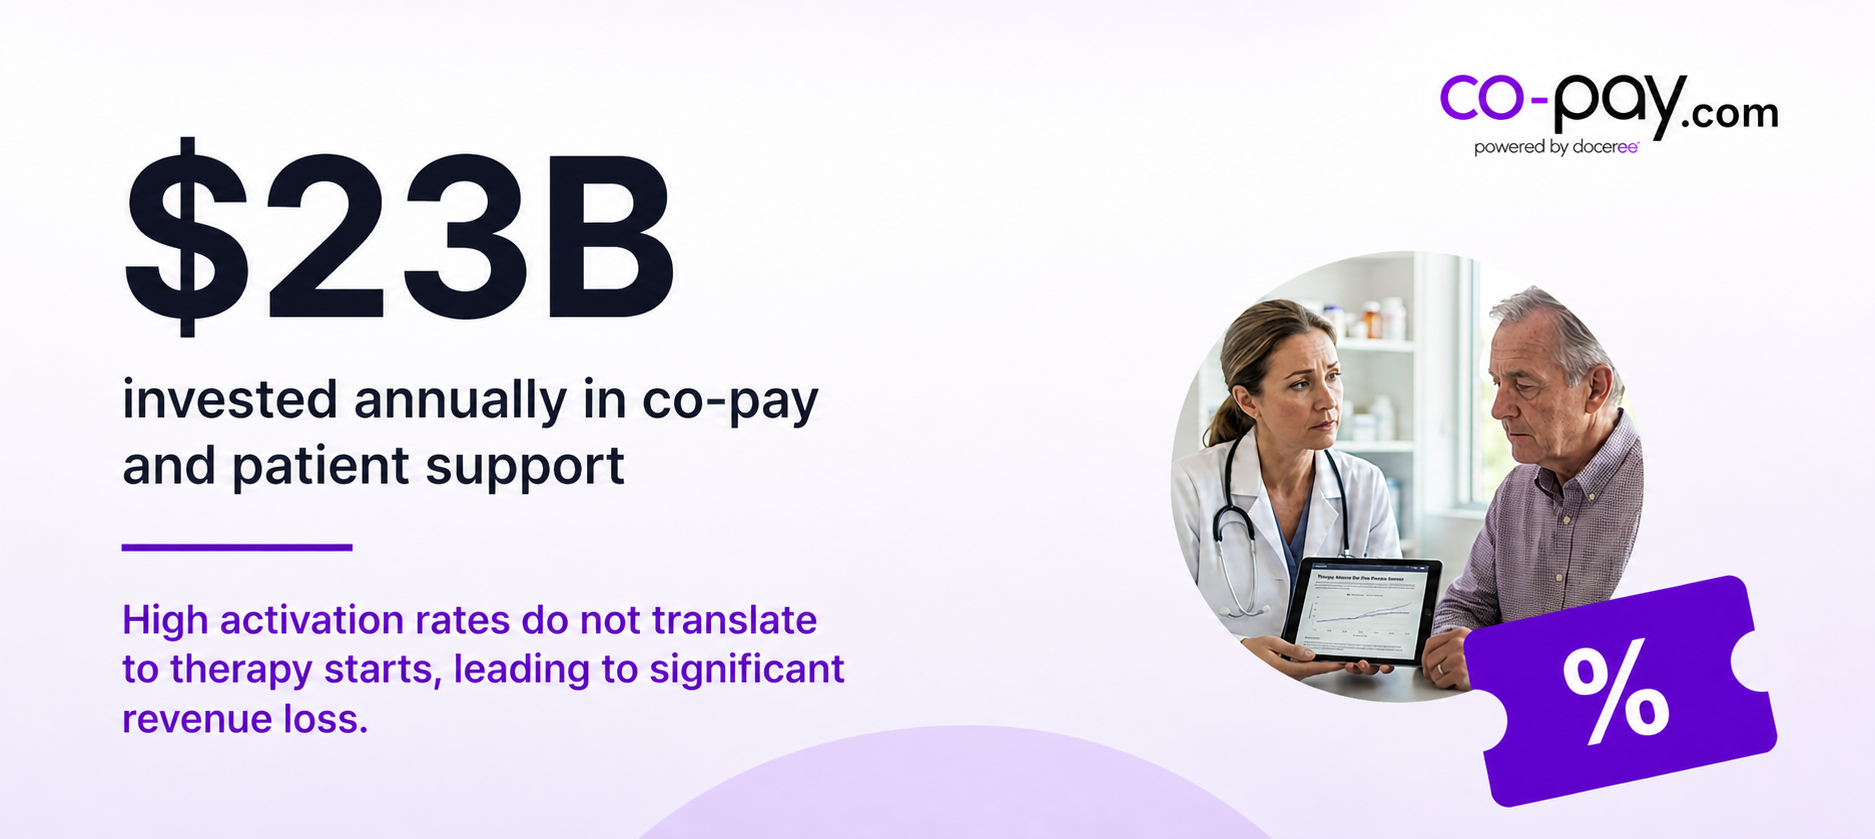
About 80% of manufacturer co-pay and patient support spend never becomes a confirmed therapy start, a pattern that now defines the category (Asembia, 2025). High co-pay program activation rates don’t translate directly into filled prescriptions: the gap between enrolled patients and those actually initiating therapy remains wide, particularly among specialty drugs. This is not a marginal issue—according to Asembia’s 2025 analysis, it’s a $23B annual problem. The workflow behind the activation process, from discovery to enrollment to prior authorization (PA), is where most of the spend leaks out. So, why does it persist? Three breakpoints—savings discovery, enrollment friction, and PA-pending at the pharmacy—explain why co-pay spend rarely delivers return at the brand P&L level.
The Numbers: High Activation, Low Therapy Starts
At the surface, co-pay card activation rates and patient-support program enrollment look strong—numbers that tend to look good in quarterly reviews and annual brand dashboards. But these program-level statistics hide a harder truth. Across the industry, $23B is invested annually in co-pay and patient support—yet the majority of those dollars do not lead to a patient leaving the pharmacy with their prescribed therapy (Asembia, 2025).
In 2024, IQVIA’s commercial Rx claims data showed that 24% of new-to-brand commercial claims were never able to gain approval within a year after the patient’s first attempt to fill (IQVIA, 2026). That’s an especially sharp figure when you consider that 70% of branded prescription attempts are initially denied coverage by insurers, climbing 13 percentage points since 2021. It means brands are facing a tightening access corridor: more patients are technically “activated” in support programs, but payer controls and workflow barriers mean those in-program patients still never start therapy.
This difference between activation and confirmed fill—the “activation gap”—shows up in every major specialty drug class. Enrollment can climb while fills stay stubbornly flat. Therapy start rates lag activation rates at a scale few manufacturers have modeling precision on, surfacing as missed targets and recurring QBR friction across specialty portfolios.
Where the Funnel Breaks: Three Predictable Points of Drop-off
The activation gap does not have a single cause. In practice, there are three major breakpoints where co-pay program dollars fall out of the funnel:
1. Discovery: Who Actually Sees the Saving in Time?
The first bottleneck happens before the patient ever enrolls. Even the most well-designed patient support programs will underperform if access to the support isn’t surfaced inside the prescribing workflow. Many brand teams rely on EMR banners, provider outreach, or pharmacy counter handouts—each with its own challenge.
The downstream effect is stark: patients discover available savings too late in the care journey, sometimes only after a medication is denied at the pharmacy. When support discovery is left to chance, even the highest-performing program can turn into a hidden resource, known mostly to the sales force and a cadre of frequent prescribers.
2. Enrollment Friction: Why Patients Don’t Complete the Process
Once a patient or prescriber does find the savings option, the next failure point is enrollment friction. Most support programs still depend on forms, portals, and multi-step processes that ask the patient to step outside the clinical flow. As a result, nearly 60% of patients who begin the enrollment process drop off before completion—often between clicking the portal link and submitting required information (Asembia, 2025; cluster composite).
For specialty drugs in particular, the problem compounds: forms are longer, supporting documentation is more complex, and patients are more likely to abandon the process due to frustration or confusion. These drop-off points are usually invisible to the brand team, registered as nothing more than another unfilled script at the pharmacy level.
3. PA-Pending: When an Activated Card Isn’t Enough
Enrollment success is necessary, but not sufficient. The largest dropout occurs after a patient receives a co-pay card and is enrolled in the program, but then encounters a pharmacy counter barrier—usually a pending or denied prior authorization.
Recent data from Surescripts shows median approval time for ePA at 18 seconds (Surescripts, 2025), but this only applies to medications and payers that have automated workflows in place, which is still an exception, not the rule, in specialty classes. More broadly, 61% of practices report accessing seven or more payer portals weekly to try to resolve PAs. Additionally, 35% spend upwards of 35 minutes per request (MGMA, 2026; MGMA, 2025).
IQVIA’s 2026 analysis shows that for commercial plans, 70% of fill attempts for new branded medicines are denied on the first pass, and nearly a quarter are never approved at all after a year (IQVIA, 2026). In this environment, it’s easy for an “activated” patient to hit a wall at the pharmacy, be told to wait, and ultimately abandon the prescription—after all the marketing spend, enrollment effort, and card activation.
This Isn’t (Just) a Benefit Design Problem
The standard explanation for why co-pay spend doesn’t drive fills is cost-sharing burden: patients avoid expensive therapy when left with high out-of-pocket. On the surface, this makes sense, especially for specialty brands where monthly costs run high and accumulator/maximizer programs can erode manufacturer support (IQVIA, 2026; Asembia, 2025). But the benefit-design diagnosis misses the operational workflow underneath.
Brand teams may believe that higher support value, looser eligibility, or more aggressive outreach will move the fill-rate curve. And there is truth here—a richer benefit can help. But the deeper issue is stubbornly operational. What matters is how the workflow connects support discovery, consented enrollment, and PA clearance inside the EHR.
More than any brand-level policy tweak, it’s these three breakpoints—discovery, enrollment friction, PA-pending—that set the boundaries for ROI.
The hidden lesson: the activation gap isn’t just about benefit design or patient awareness. It's about the ability to surface, enroll, and activate support in a workflow that meets the patient (and the prescriber) where the real drop-offs happen.
The Blind Spot: Where the Activation-to-Fill Gap Remains Invisible
If the script is dropped at one of these three breakpoints, few teams know exactly where. Most manufacturer dashboards only track enrollment completions and downstream program card activations—not which patients actually made it to the pharmacy, faced a PA obstacle, or simply gave up post-enrollment.
Without patient-level measurement from intervention to fill, the only visibility comes from aggregate pharmacy claims: “activated” support, but no confirmed script. This leaves market access and brand teams working in the dark, wondering if the dollars they spend on co-pay programs turn into actual starts.
It is in this blind spot that most of the $23B in annual investment leaks away (Asembia, 2025). And as payer controls intensify, especially among commercial plans, the problem is only compounding. Initial rejections of branded medicines have climbed 13 points over the last four years, making it even harder to close the activation-to-fill loop (IQVIA, 2026).
The structural gap is clear. Too many handoffs, not enough connected workflow, and a measurement problem that runs deeper than benefit design or point-solution sophistication.
Measurement Gap: Why Brand Teams Can’t See Pull-Through
The absence of workflow-level attribution skews every performance review. Teams see paid enrollments but lack provable insight into which support interventions translated into filled scripts. This is a prohibitively expensive problem for high-cost specialty launches.
Analytics teams try to stitch together funnel metrics from hub data, pharmacy fills, and ePA vendors. But they're hampered by misaligned schemas, lagging data handoffs, and ambiguous patient-level matching. The practical result: brand P&Ls account for patient support as a cost center, with ROI modeled in aggregate, not proved per intervention.
As more co-pay spend gets funneled into performance-based contracts, the lack of closed-loop attribution becomes untenable. The measurement gap isn’t accidental; it’s a direct result of system fragmentation. It leaves brand leaders unable to defend the economic value of their own support investments, especially as CFO scrutiny tightens during annual reviews.
The Category Line: Point Solutions vs. One Connected Workflow
Manufacturers and their partners have tried a host of interventions over the past decade. Hub services (Mercalis, Relay) handle post-prescribing patient contact and enrollment, but operate outside the prescriber's view and depend on downstream data return. ePA platforms (CoverMyMeds) can clear authorizations, but often trigger the process after the script is written, not in the moment of prescribing, and most provide no affordability surfacing at that point. Consumer coupon marketplaces (GoodRx) are built for retail, consumer-initiated savings downloads, disconnected from PA, brand-level enrollment, or any patient-level attribution to a manufacturer program. RTBC tools (Surescripts RTBC) show price but don't activate support, enroll the patient, or manage PA. Pharmacy-initiated support catches last-mile drop-off but reaches patients late in the journey.
Each vertical addresses one segment. None connects the full chain. Even as these point solutions mature, the conversion rate from "activation" to confirmed fill rarely overtakes 20–40% for specialty programs (Asembia, 2025; IQVIA, 2026). The numbers hardly move when the underlying workflow is still stitched together from separate vendors. Closing the loop requires all six functions to work together: co-pay discovery, real-time benefit check at prescribing, ePA triggered before the pharmacy, AI-guided enrollment, activation confirmation, and patient-level analytics, all inside one workflow running natively in the EHR.
What the Activation Gap Is Actually About: Workflow, Not Willpower
The pattern that emerges isn’t one of patients failing to try or benefit design falling short, but workflows misaligned to how therapy is prescribed, initiated, and filled.
The most effective support programs aren’t those with the richest benefit or the flashiest patient-facing app. They’re the systems that surface affordability at the prescriber’s fingertips, enable rapid, consented enrollment without portal friction, and pair PA submission before the script leaves the office.
This is why the activation gap persists. Discovery happens late. Enrollment friction remains. PA-pending is the default for specialty brands. Teams that see activation rates rise but fills stay flat are not witnessing a lack of patient motivation, but the stubborn inertia of a fragmented operational process.
What Good Would Actually Look Like: The Connected, In-Workflow Chain
A functional paradigm—one that could move the industry past the $23B leakage—would have to accomplish a few things:
- Surface savings and coverage at the prescribing moment: Prescribers see patient-specific affordability and co-pay options, not generic program collateral.
- Initiate consent and enrollment in-EHR: No portals, no forms, just a conversation-based enrollment captured as part of the prescriber's workflow.
- Trigger ePA before the pharmacy counter: Authorizations are started before the script leaves the office, reducing wait time and drop-off.
- Confirm activation and track to fill: Brand teams know in real time—at patient level—which interventions led to a confirmed pharmacy fill, with integrated attribution data.
- Analytics that tie every support dollar to therapy start: Finance and brand leaders can defend the investment, not just model it.
In short, six functions, one workflow, orchestrated inside the EHR—not across a patchwork of third-party systems.
Platforms That Work in this Category
Platforms working in this category—co-pay.com among them—are designed to surface savings inside the prescribing workflow, trigger ePA before the script reaches the pharmacy, and run AI-guided enrollment with consent capture. The mechanics differ across vendors, but the category bet is the same: that the prescribing moment, not the pharmacy counter, is the right intervention point. The defining differentiator is the end-to-end workflow: co-pay discovery, RTBC at the point of prescribing, electronic prior authorization, AI-guided in-workflow enrollment, activation confirmation, and patient-level analytics—inside the EHR.
The Way Forward
In an environment where payer denials are climbing and the measurement gap is more visible every quarter, the defining challenge is no longer designing the richest co-pay program, but building the workflow that actually converts it into therapy starts. Brand teams are not being let down by their own programs—they’re being let down by an industry that has measured the wrong thing, and integrated the wrong way, for too long.
The dollars aren’t going unspent, but they are going unconverted. The boardroom question lingers: if enrollment and activation curves keep improving, but fills don’t, what changes? The answer seems less about willpower or benefit generosity, and much more about timing, workflow, and attribution. That’s a category-level problem—and it will require a category-level answer.
Frequently asked questions
Why are co-pay program activation rates so low for specialty drugs?
Specialty drugs see lower co-pay activation rates primarily because of increased workflow complexity. Support is often discovered too late, enrollment requires additional documentation, and the prior authorization process introduces long delays. Even after “activation,” many patients face denied coverage or wait times that lead to abandonment. In 2024, 70% of branded fill attempts were initially denied for commercial insurance plans (IQVIA, 2026).
How much manufacturer co-pay spend never converts to a confirmed fill?
Industry estimates put the total spent on co-pay and patient support at $23B+ annually, but roughly 80% of this investment does not convert to an activated, usable saving—let alone a confirmed therapy start (Asembia, 2025). The three major breakpoints in the conversion funnel are support discovery, enrollment friction, and prior authorization delays.
What are the main reasons co-pay program activation fails to lead to therapy starts?
The failure typically occurs at three breakpoints: (1) patients or prescribers do not discover the savings in time, (2) enrollment friction in forms or portals causes drop-off, and (3) a PA is still pending when the patient reaches the pharmacy, leading to abandonment. Most brand teams lack end-to-end workflow connection and patient-level attribution (MGMA, 2026; Surescripts, 2025).
How can brand teams measure patient support program ROI more accurately?
Accurate ROI requires tracking from first intervention through to confirmed fill at the patient level. This means connecting data from co-pay discovery, enrollment, ePA status, activation confirmation, and pharmacy fill in one workflow. Measurement that relies on aggregate program metrics will always overstate ROI and underestimate drop-off (Asembia, 2025).
Does electronic prior authorization solve the activation-to-fill gap?
Electronic PA, when embedded inside the prescribing workflow, can materially reduce approval times. Surescripts reported an 18-second median approval for in-scope meds (Surescripts, 2025). But for most brands, implementation remains limited. Many clinics still manually navigate numerous payer portals each week, spending more than 35 minutes per request on average (MGMA, 2025; MGMA, 2026).
What is the typical drop-off rate between patient support program enrollment and a confirmed fill?
Nearly 60% of patients who begin the enrollment process for a support program do not complete it, often due to form burden, portal friction, or PA-based delays. The final fill rate for a typical specialty support program remains under 40% (Asembia, 2025).
How do accumulator and maximizer programs affect co-pay ROI?
Accumulator and maximizer programs operated by PBMs reduce the value of manufacturer support by preventing co-pay dollars from counting toward a patient’s deductible. This results in a higher out-of-pocket expense for the patient and further erodes the conversion of co-pay spend to actual therapy starts (IQVIA, 2026).
What capabilities define a connected workflow for therapy access?
A truly connected workflow includes: (1) co-pay discovery, (2) RTBC at prescribing, (3) ePA before pharmacy, (4) AI-guided enrollment, (5) activation confirmation, and (6) patient-level analytics. Bringing these together inside the EHR allows for closed-loop attribution and measurable ROI at the therapy-start level.
Can brand teams pilot a connected workflow without replacing their existing hub services?
Yes. Most modern platforms in this category are designed to run alongside existing hub contracts, not replace them. This enables brand teams to pilot closed-loop attribution and activation workflows in parallel, minimizing risk and operational lift (Asembia, 2025).
This argument doesn’t close with a tidy fix, because the industry’s workflow isn’t built to deliver one. The right answer is structural, not just tactical. The measurement gap and activation gap are two symptoms of the same design: a system built for enrollments and activations, not for therapy starts. That’s what needs changing.
Leave a Comment